
Fonte: ISTAT
Le esportazioni a luglio 2008 sono andate piuttosto bene, anche se la tendenza al rallentamento continua ad essere percepibile. Nel mese, il valore delle esportazioni e’ salito del 6% a EUR351m, nonostante un calo del 7% del volume a 1.67m/hl. A livello annuo continua quella fase di graduale deterioramento del saldo export: siamo ora a +6% sui valori (rispetto a +8% fino a Marzo) e a -8% sui volumi (contro il -5% di Marzo). Nota particolarmente positiva: in luglio tutte le categorie di export sono andate abbastanza bene, con un +6% dei vini imbottigliati (dopo due trimestri negativi), un +2% per i vini sfusi e un +9.8% per gli spumanti. Si apre ora un periodo di “calma” considerato che sia Agosto che settembre sono due mesi un po’ piu’ scarichi. Approfitterei pero’ oggi per dare una visione un po’ piu’ di lungo termine sul tema esportazioni. Invece di focalizzarci sui dati per categoria o per paese, penso sia interessante provare ad allargare un pochino il tiro e guardare ai numeri dal 2005 a questa parte. Vi propongo quindi 3 grafici, dove potete apprezzare come si sta muovendo il saldo annuo delle esportazioni e della bilancia commerciale. Il grafico esprime sempre la somma o la media (per il prezzo) dei 12 mesi precedenti, con una sorta di anno mobile.
[TABLE=94]
Exports in July 2008 went quite well, although the slowdown is becoming more and more evident. In July, the value of exports increased by 6% to EUR351m, despite a decline of 7% of the volume to 1.67m/hl. The annual trend continues to deteriorate gradually, we are now at +6% for values (compared to 8% up to March) and +8% for volumes (compared to 5% in March). However, I would note that in July all categories of export were positive, with 6% of bottled wine (after two negative quarters), a 2% for bulk wines and a +9.8% for sparkling wines. We now have a period of “calm” between August to September, two months not really relevant. Today we give a long-term view of the export trend. Rather than focusing on data by category or by country, I think it’s interesting to try to expand a bit and look at the numbers from 2005 to now. I propose 3 graphs, where you can appreciate how you are moving the annual level of exports and trade balance. The graph always expresses the sum or the average (for the price) of the previous 12 months, with a sort of rolling year.
Partiamo con i valori. Ormai sembra che da qualche mese facciamo fatica a superare i 3.6 miliardi di euro. Dollaro debole e volumi sono sicuramente le due cause principali. Insieme al saldo totale delle esportazioni si e’ anche bloccato a circa EUR3.2bn il saldo della bilancia commerciale: sostanzialmente siamo arrivati a un punto in cui le esportazioni e le importazioni si stanno muovendo allo stesso passo (in valore assoluti).
We start with values. It is now a few months that Italian wine exports are struggling to exceed 3.6 billion euros. Dollar and volumes weakness are certainly the two main causes. Together with values, the total balance of exports is frozen at about EUR3.2bn: basically we reached a point where exports and imports are moving at the same pace (in absolute value).

Il grafico dei volumi e’ invece quello piu’ interessante, perche’ vi fa rendere conto di del fatto che dal picco abbiamo gia’ perduto 1.5m/hl di esportazioni annue. E’ molto: considerando una vendemmia media di 45m/hl si tratta di un 3-3.5% della produzione di vino che non viene piu’ mandata all’estero e che l’Italia si deve in qualche modo sobbarcare.
The graph of the volumes is more interesting, because you can see that we are 1.5m/hl off the peak. It is a lot: by taking an average production of 45m/hl a year this is a 3-3.5% of the production of wine which is not sent abroad and that Italy must somehow absorb.

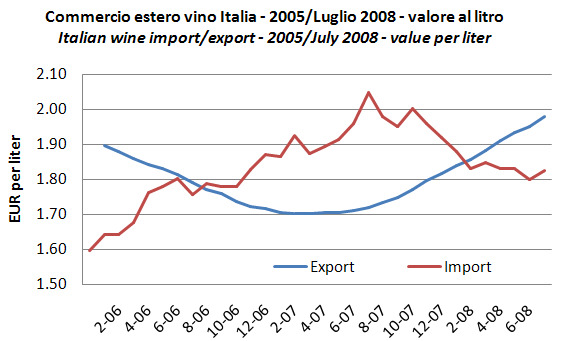
Terzo grafico. Il prezzo mix. Questo e’ un bel grafico. Prezzi piu’ alti significano migliore qualita’, miglioramento del mix. Tutte le categorie stanno crescendo, ma va ricordato che una parte importante di questo miglioramento e’ da attribuire al fatto che gli spumanti (che si vendono a un prezzo medio piu’ alto delle altre categorie) stanno aumentando il loro peso sulle esportazioni. Questo flesso del prezzo medio a cui esportiamo e’ esattamente il contrario di quanto successo alle importazioni, che per un certo periodo avevano un prezzo medio piu’ elevato, sostanzialmente grazie al peso dello Champagne nella media.
Third graph. The price mix. That’s a nice chart. Prices are higher and higher, meaning better prices or improving mix. All categories are growing, but it should be noted that an important part of this improvement is due to the fact that sparkling wines (which are sold at an average price higher than the other categories) are increasing their weight on exports. This inflection in the average price at which we export is exactly the opposite of what happened to imports, which for a few months had an average price higher than what of Italian exports, mainly due to the weight of Champagne in the average.
Nei prossimi mesi l’andamento delle esportazioni di vino sara’ da monitorare con attenzione. Le cattive notizie relativamente all’andamento dell’economia sicuramente avranno un impatto anche su questi numeri. Non ci sarebbe da stupirsi di vedere accelerate alcune tendenze negative che per ora sembrano soltanto abbozzate.
In the coming months the trend of exports of wine will have to be monitored carefully. The bad news regarding the development of the economy certainly will have an impact on these numbers. We should not be surprised to see some negative trends that now seem only sketched becoming more evident.


Purtroppo le vicende come quella del Brunello non sono di aiuto alle esportazioni. E’ giusto continuare a confidare negli “intenditori” stranieri e rinunciare al grande pubblico come fanno invece i francesi?
[…] Esportazioni di vino nel mondo Per quanto riguarda la situazione italiana segnalo questo articolo Esportazioni di vino italiano – aggiornamento luglio 2008: bene, ma tendenza al rallentamento. Nel mese, il valore delle esportazioni è salito del 6% a 351 […]